Quick Start
This page will walk you through the basics to get up and running with BERT. If you haven’t already done so, you can download an installer from our downloads page.
The Interface
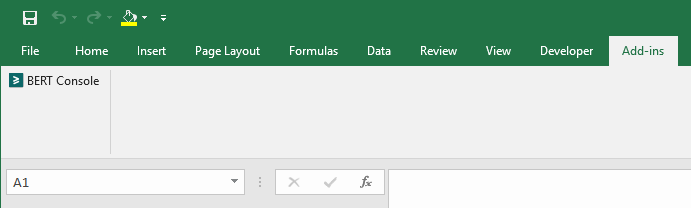
After you have installed, start Excel. You’ll see the Add-ins tab on the Excel ribbon menu (toolbar). Click the Add-ins tab and you’ll see a button for BERT:
Using the Console
Click the BERT Console button to open the console. The console includes a code editor and an integrated R shell. The shell is a standard R environment. It’s also where you can see errors or warnings (or anything you print) from your spreadsheet functions.
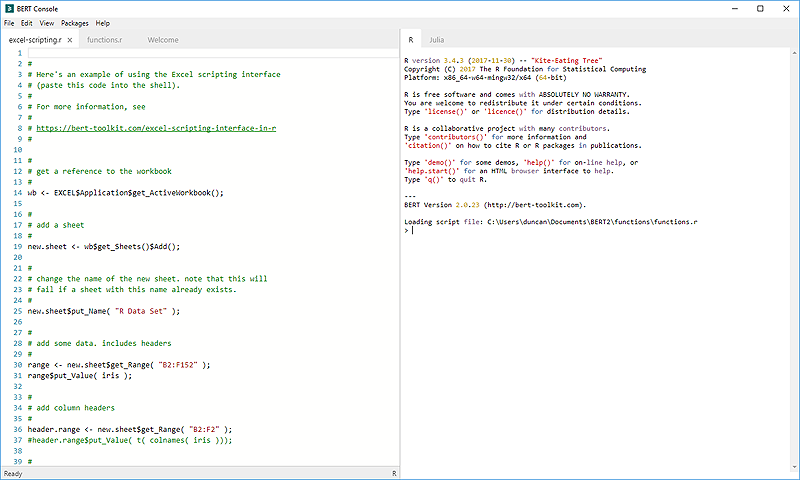
From the shell you can interact directly with Excel and your spreadsheet. For a quick example, open the “excel-scripting.R” file in the console editor. This should already be open (we open it by default when you install), but if not, it’s in your Documents directory, under BERT2/examples.
Right click the code in the editor and select “Execute entire buffer”. This code will add Fischer’s iris data set to your spreadsheet. For more on interacting with Excel, see the page on the Excel scripting interface.
Using R Functions in Excel
Next up is writing Excel functions. Switch back to the Excel window (you can close the console; closing it won’t erase or remove anything).
When BERT exports functions from R to Excel, it adds the prefix R. (R-dot). This is done so there’s no conflict with internal Excel functions. For example, the startup file includes a function TestAdd which just adds numbers together. When BERT loads this function into Excel, it’s called R.TestAdd (R-dot-TestAdd).
You can use that function like any other spreadsheet function; just type =R.TestAdd(1,2,3) into a spreadsheet cell. This function uses a three-dots (…) argument, so it takes a variable number of arguments.
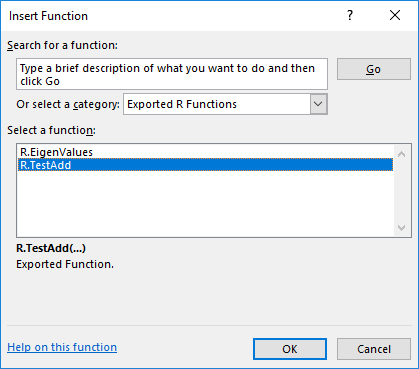
All the R functions in Excel are also listed in the Excel function wizard. Click the f(x) button on the toolbar or press Shift+F3. In the category box, select Exported R Functions.
Writing Your First Function
Let’s add a new function to Excel! Open the console (click the BERT Console button on the Add-ins tab).
BERT loads functions from files in the startup folder. By default, the startup folder is Documents\BERT2\functions. You can add new files to this folder, but for now just edit the sample file functions.R. That file should already be open in the console editor, but if not you can open it using File > Open from the menu.
We’re going to write a function to get the Cholesky decomposition of a matrix. If you’re not familiar, it’s not that important; for this example, the how of writing a function is more important than the what. Suffice to say that this is difficult to do in Excel or VBA, but it’s already built in to R. So all we have to do is write some code to expose the internal method.
We’ll call the method Cholesky. Add this code to the functions.R file:
Cholesky <- function(mat){
  chol(mat);
}
Then save the file using Control+S or File > Save from the menu. BERT will automatically reload the file when you save it. You’ll see a note in the shell. If you made a mistake, you may see an error instead. In that case, double-check the function code and re-save the file.
Here we’re calling chol, R’s built in method for the Cholesky decomposition. The input is a matrix, and the output is a matrix. Because our new function is called Cholesky, BERT will install it in Excel as R.Cholesky.
The Cholesky function works on matrices that are symmetric and positive-definite.
| >> | Decomposition | >> |
|
Fill in a 3x3 range in Excel with the data in the above-left table. Then select another 3x3 range for the result. With the range selected, enter the function =R.Cholesky() and select your first matrix as the input. Then press Ctrl+Shift+Enter to enter the function.
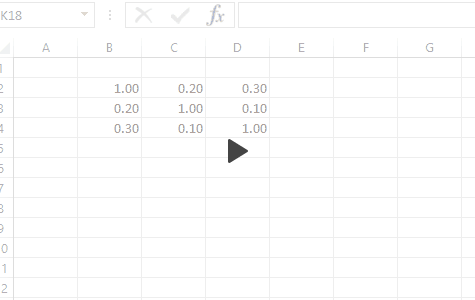
You have to press Ctrl+Shift+Enter to enter the function as an Array function, because it returns a matrix. If you just press Enter, it will only enter the function in one cell and you’ll see just one value. In that case, just re-select the range, enter the function, and press Ctrl+Shift+Enter.
Decorating Functions
That’s all you need to do to get your R functions working in Excel. If you want to get a little more fancy, you can add some function documentation and use custom function categories.
This is all done with R attributes. We use two specific attributes: category and description.
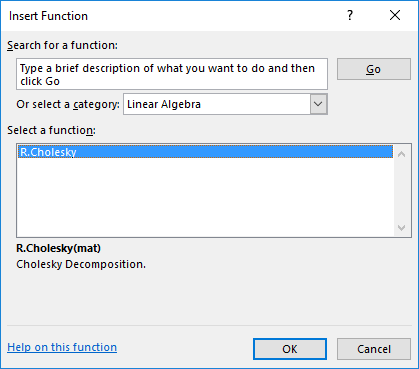
The category attribute is just a string; this will be the category used in the Excel insert function dialog, instead of “Exported R Functions”. For example, we can change the category for the Cholesky function by adding the following code to functions.R:
attr( Cholesky, "category" ) <- "Linear Algebra";
If you switch back to Excel and click insert function (Shift+F3), you’ll see this function in the new category:
You can add function documentation with the description attribute. This attribute is a list. The first entry in the list is the description of the function itself. After that, use named arguments matching the parameter names to describe each parameter. For the Cholesky function, we want to add a general description, and then describe the mat parameter:
attr( Cholesky, "description" ) <- list( "Cholesky Decomposition",
  mat="Input matrix (must be positive-definite)" );
Now when you use that function, the Excel function dialog will show the descriptions:
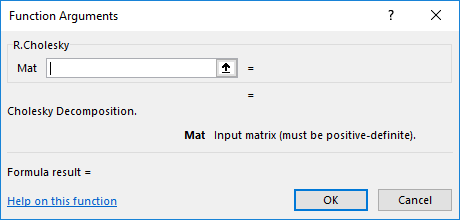
Note that Excel adds periods after everything, we can’t change that.
Learn More
To learn more, see some example functions; read about talking to Excel from R; and check the rest of the documentation links at the top of the page.