R Graphics in Excel
Excel is perfectly capabable of generating nice charts. However in some cases you may still want to use R (plus packages like ggplot2) to generate graphics.
Starting with version 1.30, BERT includes a graphics device that can insert charts into your spreadsheets, and update them when the source data changes.
How it Works
The BERT graphics device draws graphics into named shapes in Excel spreadsheets. In Excel, a Shape is an object that exists in the spreadsheet – things like text boxes, pictures, and “smart art” are all shapes.
When you create a BERT graphics device, you give it a name (or use the default name). When you draw a chart, BERT will create a Shape with that name and insert the drawing there. If you update the chart later, BERT will find the existing shape and update the image.
Here’s the simplest usage (paste this in the BERT console):
BERT.graphics.device();
hist( rnorm( 1000 ));
Then if you draw a new chart, it will replace the old one:
plot( rnorm( 100 ));
Create another device, with a different name, for a second plot in the spreadsheet:
BERT.graphics.device("number 2");
plot( sort( rnorm( 1000 )));
(These shapes may wind up one on top of the other. If you don’t see both charts, try moving one around with the mouse).
List active devices with dev.list(). When you’re done with a graphics device, you can deactivate it with dev.off(). This isn’t very important, except that R has a limit of 63 devices so deactivating devices when you’re not using them is generally a good idea.
Plot Size
The BERT.graphics.device function takes parameters for width and height, specified in pixels. R uses inches by default, so be sure to scale up if you are used to using inches.
BERT.graphics.device(width=600, height=400);
plot( sort( rnorm( 1000 )));
There is an additional scaling factor that increases plot size for high-DPI displays. This happens automatically, but you can disable it if desired. See ?BERT.graphics.device for more information.
Moving & Resizing
The BERT graphics device will not redraw when you resize it. However, if you update the chart, it will draw with the new size. So after you resize a graph, just redraw it and it will update correctly.
You can move a Shape around, even to another sheet. As long as it’s in the same workbook, it will update correctly. If you delete a Shape that’s attached to a BERT graphics device, BERT will create a new one the next time you use it.
Linking to a Cell
If you are calling the graphics device from a spreadsheet cell, you can automatically generate a name that’s linked to the function cell. That way, you can have different functions generating different charts, and you don’t have to remember which is which. Do that by passing cell=T when creating the device:
graph.test <- function(){
  BERT.graphics.device(cell=T);
  ...
}
If you use a graphics device in a cell, you can also ensure that the chart will update when any source data updates. See the example below.
Example
We can create a spreadsheet function that draws a plot of some data. Because the data is input to the function, any time the data changes in your spreadsheet, the chart will update automatically.
graph.plot <- function(data, label=NULL){

  # link the graphics to the calling cell, so it won't get erased
  # when another cell draws a plot
  BERT.graphics.device(cell=T);

  # flatten the data and make sure it's numeric
  data = as.numeric( unlist( data ));

  # draw the plot
  plot(data, pch=21, bg="pink", col="red", main=label );
  lines( lowess( data ));

  # we're done with the graphics device, so shut it off for now
  dev.off();

  # this is a convenient return value for the calling cell
  T;
}
Use this function in a spreadsheet and it will plot the selected data:
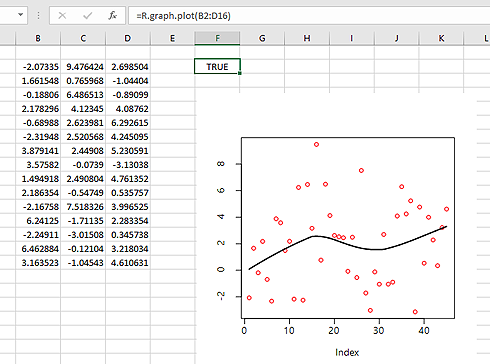
Update the data and the plot will update to reflect it. Try using it with random data (like Excel’s RAND(), for example) and then recalculate the spreadsheet.
Maps
One chart type you can’t normally draw in Excel is a map. Using the maps package in R makes this easy:

The code for this example is on the example functions page. Because it’s a function, the map will update if you add or remove countries or change values.